Why SAP reporting becomes a bottleneck
Timely MIS and business insights has become extremely important in today's era. In a typical SAP-run organisation, developing MIS and Business Insight reports remains a major challenge due to:
- ✓lot of dependency on ABAPers to develop and change reports.
- ✓Extensive bandwidth requirement from Functional consultants, Support Partners.
- ✓Reporting activity turns out to be highly Cost intensive.
- ✓The last mile connectivity still stays manual with several iterations.
- ✓MIS is done manually which consumes lot of operational bandwidth during the month.
- ✓Output and reports are generally delayed.
Our solution has several benefits over solutions like Power BI, QlikView, Tableau and other solution making your reporting, MIS and dashboarding a smooth journey. Most important of them is MyReport BE is Simple to Create, Deploy and Manage.
MyReport BE is Simple to Create, Deploy and Manage.
Outcome
Get the right numbers to the right people, at the right time — across Excel/Office, Web (mobile/tablet), and dynamic TV screens.
Make data visible at every level
Availability of Data no longer needs advocating and knowing it at various levels of hierarchy is everyone’s need.
Letting people know the right numbers at the right time and in the right format is extremely essential to run operations. Our solution can help you to get your MIS, Business Insights on 3 different platform which includes Microsoft Office (Excel, Word, PowerPoint), Web (Tablets and Mobiles) and Dynamic TV screens.
Do not push your team to check all the data on just 1 platform. This kind of thinking ignores the more common pain points of bringing data sources together, cleaning and transforming the data, and doing the actual analysis itself, which, if you ask any analyst, are the most traumatic parts of any analysis. By not investing in these problems, you are telling your data team that their work is less important than the business’s interpretation of it.
Recommended components for best ROI
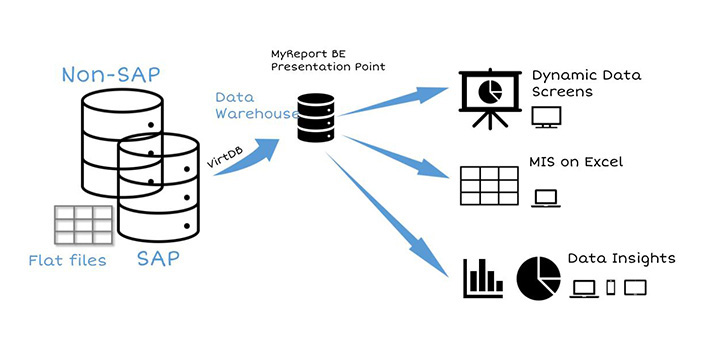
A practical architecture to extract, model, and visualize SAP data end-to-end.
| SAP Add- On | Scheduled Optimization of SAP tables for export. |
| VirtDB | Scheduled Export Table, Queries, Reports to any SQL. |
| MyReport BE | Scheduled Modelling and Transformation of Data into optimized data marts in SQL. Build and View Reports and Dashboards in Excel, Word, PowerPoint, QlikView, Tableau etc. We can still help you with the DataMart engine to enable and support your existing tools. |
| Presentation Point | View dynamic KPI’s, Reports from SAP and Machines on TV Screens P.S: In case you are using any other visualization tool like Power BI, O365 Build and View Reports, KPI’s and Dashboards on Mobile and Tablets |
VirtDB + MyReport BE
VirtDB supports seamless data extraction to SQL backends and then further into Datawarehouse using MyReport BE. There are lot of ODBC drivers for on-premises and cloud-based applications to get your data for reporting and MIS.
Watch it in action
Need more information to start your MIS and Business Insight project for SAP?
Talk to our team to scope your SAP MIS & Business Insight rollout — from extraction to dashboards and screen displays.